Facebook Ads Manager has more metrics and features than you can shake a stick at.
Some metrics are super useful for lowering your CPA, while others are just vanity metrics or features that provide very little actionable insights.
In this article, I’m going to show you three reporting features I use in the Facebook Ads Manager to lower my overall CPA or minimize ad wastage.
1. See ad performance based on time
You can see how your campaigns, ad-sets, and ads perform by each hour of the day.
To do this you’ll need to click the ‘Breakdown’ column and select ‘By Delivery’ and then ‘Time of Day’ (ad account time zone):
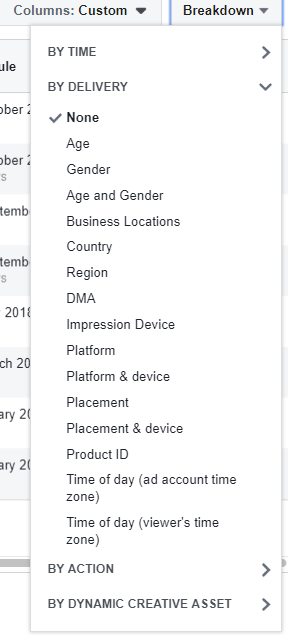
Facebook will then break down your campaigns per hour showing you at what hours of the day your conversions happen.
Look for times of the day where your ads are providing you with your intended results. For example, if your campaign is optimized for purchases, is there a specific period of the day where sales happen more frequently?
You may find that you’re wasting ad spend in the early hours of the morning or late at night and can adjust your campaigns to serve at times when users are most likely to make your action.
You can also break it down by the time zone based on the user, but I’d stick to time zone based on your ad account as you cannot serve ads based on a user’s time zone.
2. Delivery Insights
Delivery Insights is a Facebook reporting tool that gives you a behind-the-scenes look at how Facebook delivers your campaign in their auction.
Once your ad-set has been running for five days and has received 500 impressions or more, you’ll see the Delivery Insights option when you hover over the ‘Delivery’ tab.
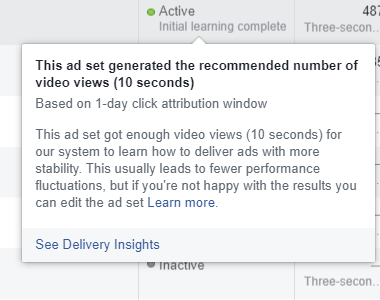
My go-to metric here is the first-time impression ratio.
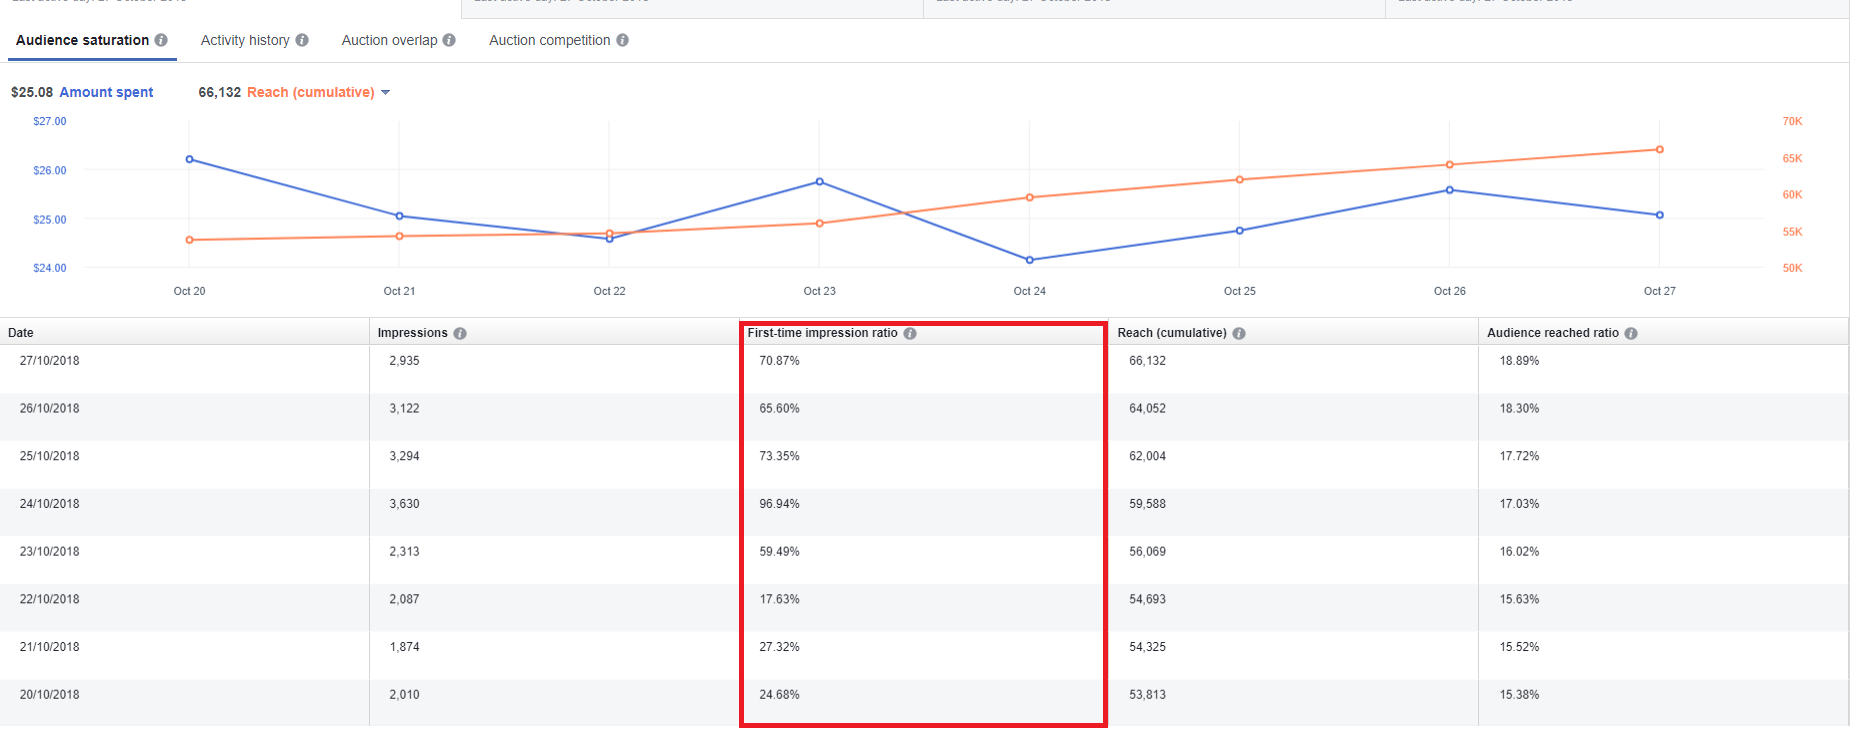 The first-time impression ratio reveals how many people in your audience saw your ad for the first time. This is an important metric to keep an eye on for campaigns at the top of your funnel. When you see your first-time impression ratio go under 60%, then the performance in your ad-sets drop. It’s a useful sign that it’s time to expand your audience or refresh your creatives.
You can also check to see if your campaign is overlapping with other ad-sets in your ad account by clicking the ‘Auction Overlap’ tab.
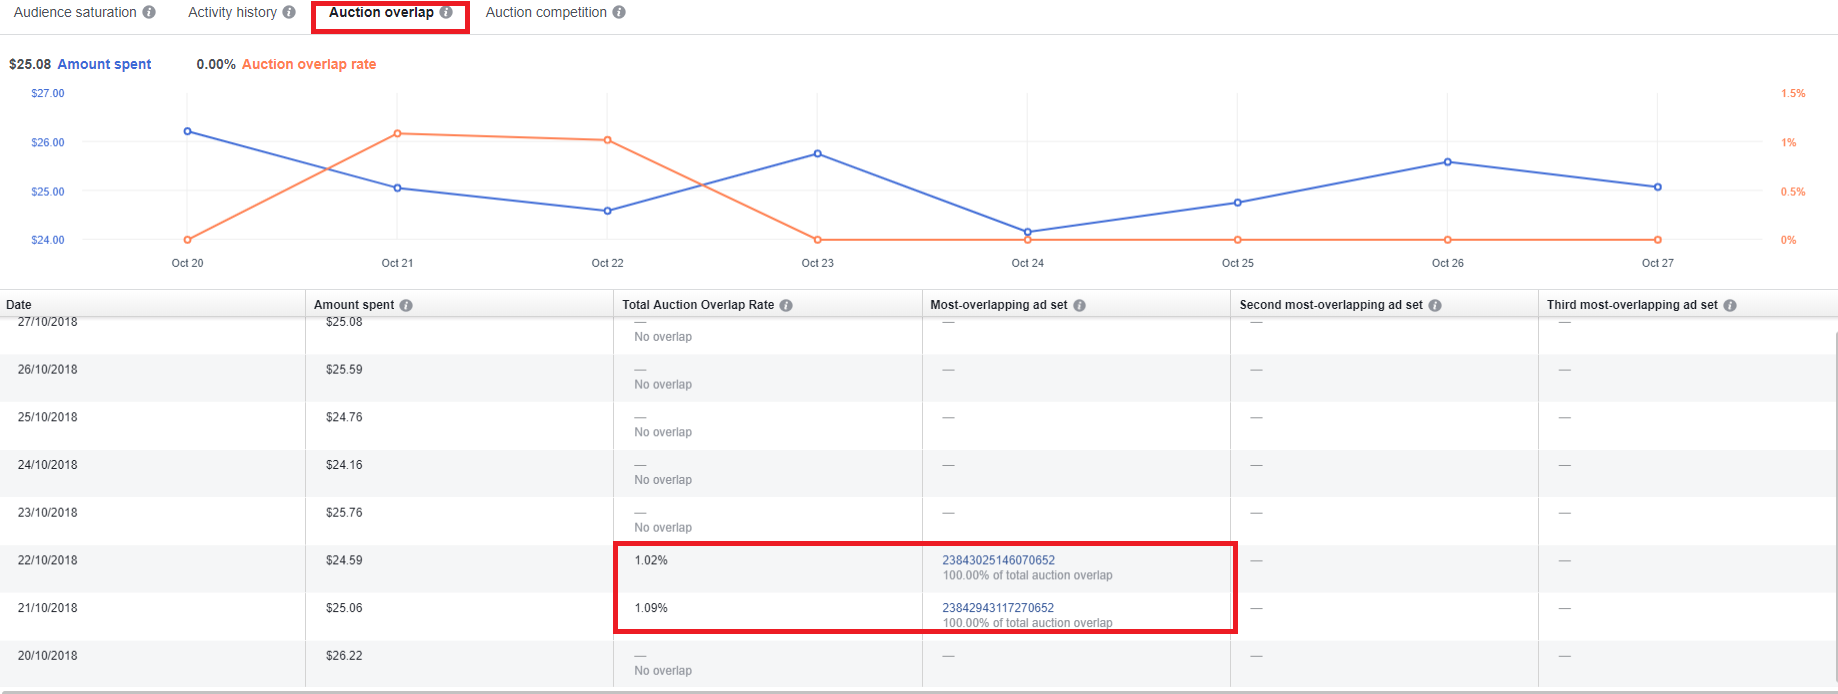
If multiple campaigns have an auction overlap of 25% or more, this may be a sign that your audience targeting is too narrow across your account and users are in multiple campaigns. A high audience overlap is a sign that you’re serving the same ads to the same people.
Create your own columns for actions
Facebook provides you with 12 preset columns to see how your campaigns are performing, but you can also make your own – and you should.
To make your own metrics panel you need to choose the ‘Customize Columns’ tab and select the metrics that are most important to you.
I like to use the following metrics panel to see how my funnel is performing:
- Website content views
- Website add to carts
- Cost per website add to carts
- Website purchases
- Website purchases conversions
- ROAS
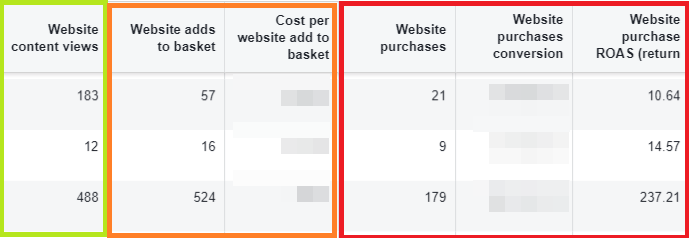
Website content views is the first step in my funnel (view landing page or product page).
The second step would be if the user added anything to their basket.
The third step would be for them to purchase.
By creating this type of metrics panel, I can visually see how my ad-sets are performing and quickly identify if there is anything wrong with my funnel.
For example, if I receive a good amount of website content views but no add to carts, then it’s a sign that either my landing page isn’t strong enough or I’m attracting the wrong audience to my store.
If I’m receiving a healthy amount of add to carts but no sales, it’s a sign that there may be a conversion issue on my website.
Find metrics that matter
Facebook gives you well over 100 metrics to see how your campaigns are performing, so pick the ones that matter to you the most and they will give you actionable insights to improve your overall ad account management.
Use these three tips today to lower your overall Facebook CPA and minimize ad spillage.