Performing regular ad audits on your Facebook campaigns is critical to the success of your entire Facebook marketing strategy.
Auditing your campaigns correctly helps you to identify which types of offers work, which audiences are most profitable, and reveals clues on how you should be setting up your future campaigns.
It also allows you to cut losers faster and scale the winners to maximize your ROI.
In this article I’m going to reveal some useful metrics to audit when reviewing any of your Facebook ad campaigns.
Manual bidding can skewer your ad audit
Before I start this article, I want to make a point about manual bidding impacting your metrics.
If you’re underbidding for your actions, Facebook will serve your ads to people who are least likely to take action. This, in turn, will lower your click-through rate, conversions, relevance score, and everything else.
Before any auditing is undertaken, just make sure you’re not underbidding for actions, because no matter what you change, if your bids remain low your campaigns will underperform.
Is your messaging and targeting on point?
To gain an understanding of how a campaign is performing, the first thing I’ll look at is relevance score.
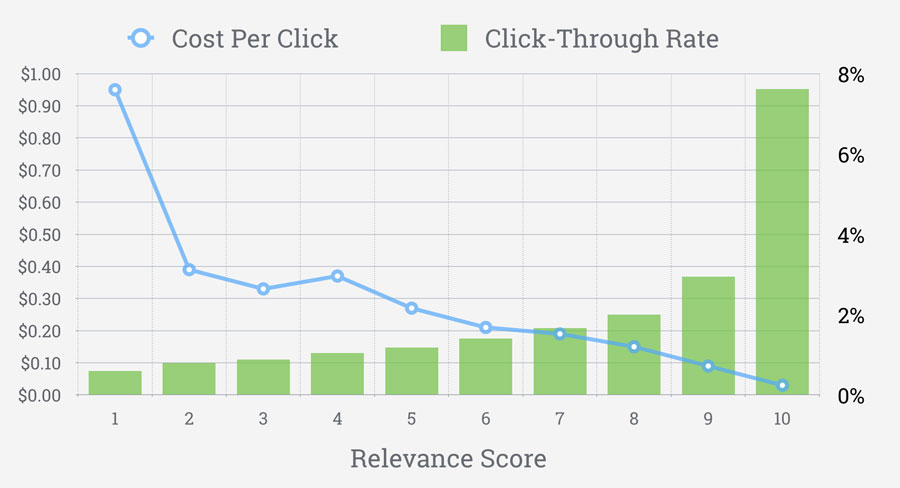
Relevance score is a 1-10 score that Facebook gives your ads based on interactions from your audience. You can find your ad’s relevance score by going to the ads section of your Ads Manager.
The higher the click-through rate, the cheaper your ads will cost.
 (Source)
Ideally, you want your ads to have a relevance score of 7 or higher. A low relevance score means you’ll be paying more for your actions because Facebook doesn’t think your ads provide a good user experience to your audience.
Relevance score is a metric best used when targeting new audiences and creatives to gain an understanding of how they view your ads. If your ads are scoring low and you have dozens of adverts, then this is a sign that your targeting is off.
How to see if your campaign is reaching your goals
Each campaign you create must have a goal.
For example, if you’re using the video views objective and targeting lookalike audiences, your goal is to reach new prospects.
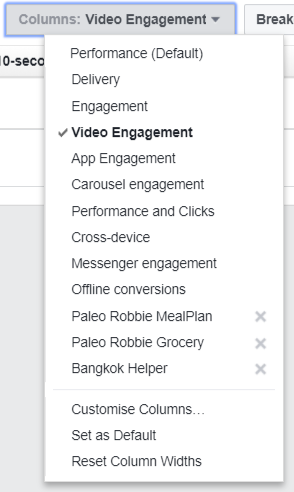
To see if this campaign is reaching its goal, within the ad set I’d choose the video engagement objective:
Then I’d look at video views by the percentage viewed.
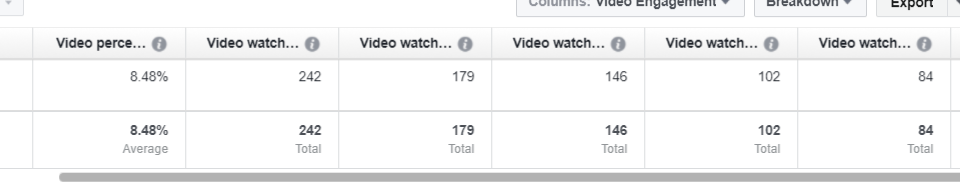
From a total of 4,141 impressions, only 86 managed to make it all the way to the end of the video. This is very low and the video is not reaching its goal.
This video just happened to be 1 minute 30 seconds long, which is way too long to keep someone’s attention on Facebook, especially cold audiences. A possible solution to reach this goal is to create a new shorter video.
Now let’s say you’re running a campaign using the conversions objective. The first thing you’ll want to check is the cost per conversion (CPC).
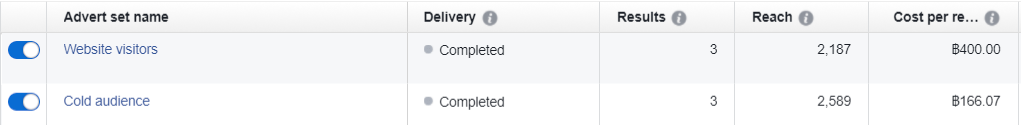
In the image above, cold audiences are converting at 50% less than website visitors, which is strange as you’d expect website visitors to convert at a cheaper spend.
There are a number of reasons why this can happen, such as re-targeting website users for too long (i.e. anyone who visited the website in the last 180 days). The longer someone hasn’t visited your website, the less engaged they are
It may be because you’re targeting the wrong audience in other campaigns and they have now slipped into your website custom audience.
Or as in the case of this campaign, the daily budget for website visitors was set too high. The bidding was set to automatic, which increased the amount of times a user viewed the ad, increasing the cost (select Delivery from the columns tab).
The reason for a higher cost per conversion wasn’t because the cold audience was better at converting than website visitors, but because the ad was shown way too many times to the audience.
When you spot an issue with one of your campaigns, there are many reasons for it to be the way it is. As a marketer, it’s your job to drill down potential causes for the problem and find a solution.
When auditing your metrics, be sure to only look at metrics that matter. I typically look at the following
- Cost per click
- Cost per conversion
- Click-through rate
- Relevance score
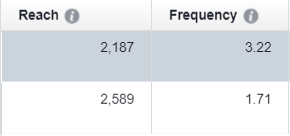
- Frequency
- Placement performance
Avoid measuring vanity metrics like reach, impressions, page likes, or organic reach as these don’t give you any meaningful data to work with or help find bottlenecks.
When clicking on the ‘columns’ drop-down within the ad set level, you can customize your columns based on the metrics that are most useful to you.
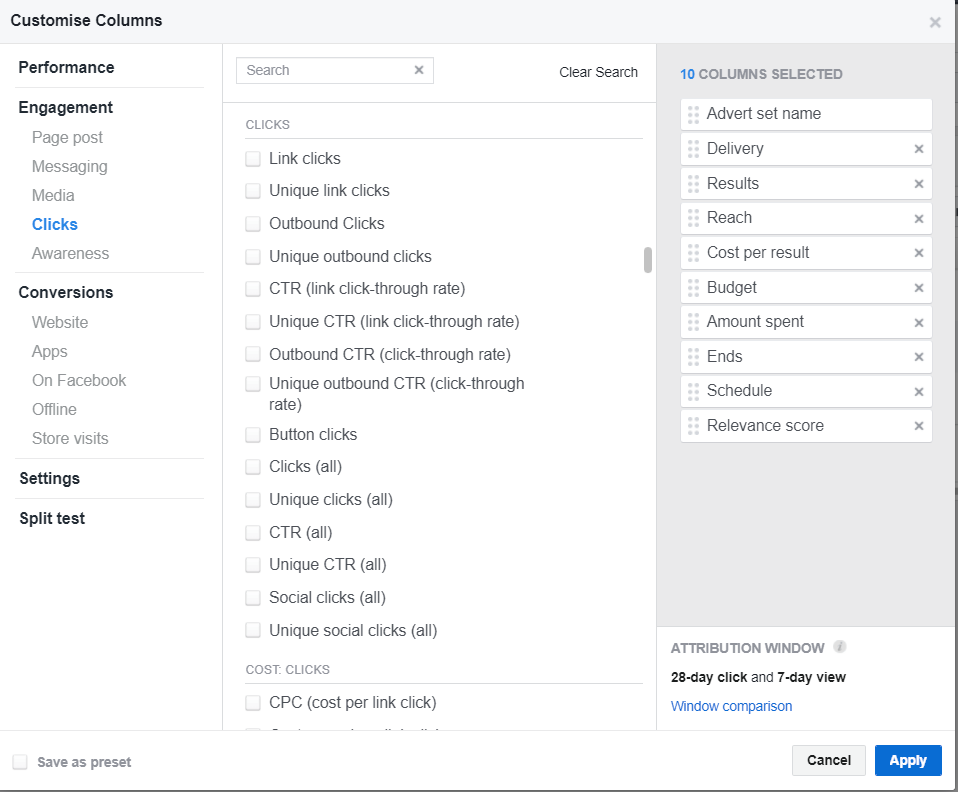
Simply select the metrics that are most important to you and hit the ‘Apply’ button. If you would like to save your columns, then tick the checkbox in the left-hand corner.
Placement
ad placements are a big deal, not only to cut placements that are providing you a negative ROI, but also to identify new placements that you can scale.
You can find metrics about your ad set’s placement by pressing on its checkbox and clicking on the chart symbol on the right-hand side of your Ads or Power Editor.

As expected, the Facebook newsfeed is converting well for the campaign below, but it also seems that for this particular ad set, the Messenger placement is providing a better cost per conversion than the Newsfeed placement.
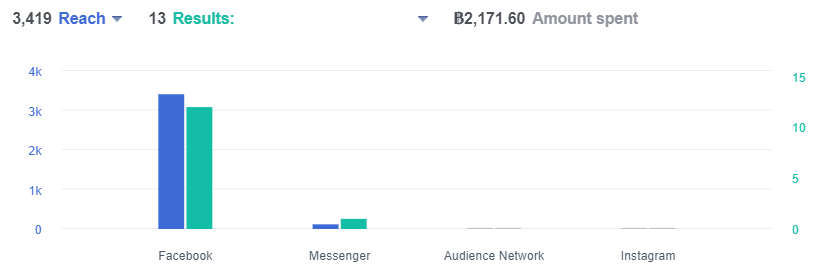
While the reach for the Messenger placement is low – meaning there’s not enough data to prove its value – it’s certainly worth testing out.
On the flip side to reviewing placements, you may find that your Instagram or Audience Network placements aren’t converting and need to be pulled or tested in isolation.
Delivery Insights
Different types of campaigns require a different kind of audit.
For example, evergreen campaigns (campaigns that never stop running) or campaigns with a high daily budget must be audited with Delivery Insights.
Delivery Insights is a Facebook tool that reveals the following information about your ad set
- Activity history (changes you’ve made by date)
- Auction overlap (if your audience is overlapping with another ad set)
- Audience saturation (how much of your total audience has seen your ad)
- Auction competition (how many people are targeting your audience)
Data is shown after five days of an ad running which has received more than 500 impressions.
Delivery Insights is useful when a campaign that was going well suddenly stops performing in the way it should.
Below is an audience saturation screenshot for a particular campaign. As you can see, it has reached over 50% of the entire audience and on the 18/09/2017 the first-time impressions went as low as 15.5%.
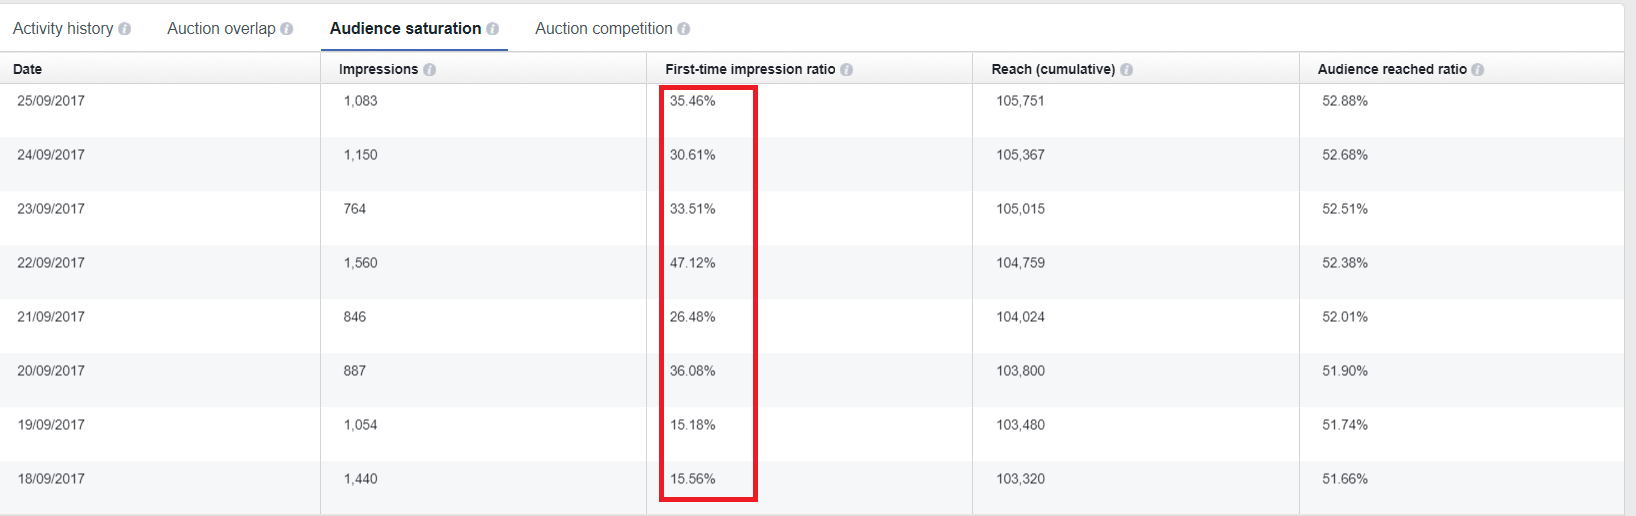
You’ll notice that on September 20 the number almost doubled. Why? The answer is because the manual bid was adjusted higher to reach high-quality prospects that were unable to be reached with the current bid.
Another way to solve the audience saturation problem would be to target a wider audience, lowering the number of people reached and the first-time impressions ratio.
Delivery Insights is best used with evergreen campaigns that have been running for a while as the metrics they provide are only useful after time has passed.
When a sudden change occurs, they will also alert you in your Business Manager panel.

Your turn
There are many ways to perform a Facebook ad audit given the vast number of metrics you can view.
The secret is to look at the metrics that provide you with the best details on what may be going wrong and what you must change to fix it.
Two heads are better than one when it comes to auditing as you can bounce ideas around as to why things aren’t working in the way that they should.
There can be a number of possible reasons why your click-through rate or conversion numbers are low. If it’s not because your ad copy is bad, it may be because you’re bidding too low and receiving lower-quality traffic, or it may be because you’re using the Audience Network which may not be optimal for your offer.
I don’t recommend you follow industry-standard benchmarks either as audiences, budget, and your marketing team will have an impact on numbers. Instead, write down the most important metrics for the previous month and compare them with the following month to see where you’re going right and where you’re going wrong.