You may have noticed over the past few months that Facebook has added a few features to its Ads Manager and Power Editor.
One of its newest additions is Delivery Insights, a free analytical tool that provides you with additional information where your campaigns may be faltering, focusing primarily on auction overlap or audience saturation.
In this article I’ll discuss how to use Delivery Insights to dissect metrics to troubleshoot campaigns.
Viewing Delivery Insights
You can view a campaign’s Delivery Insights at the ad set level. To be able to utilize Delivery Insights, your ad set has to meet the following criteria:
- Run five days in a row or more
- Have 500 or more impressions
- Experience a shift in performance
You will know when an ad has qualified because you’ll see the ‘See Delivery Insights’ icon in the Delivery column:

Filter options
You can filter your ad set by the following parameters:
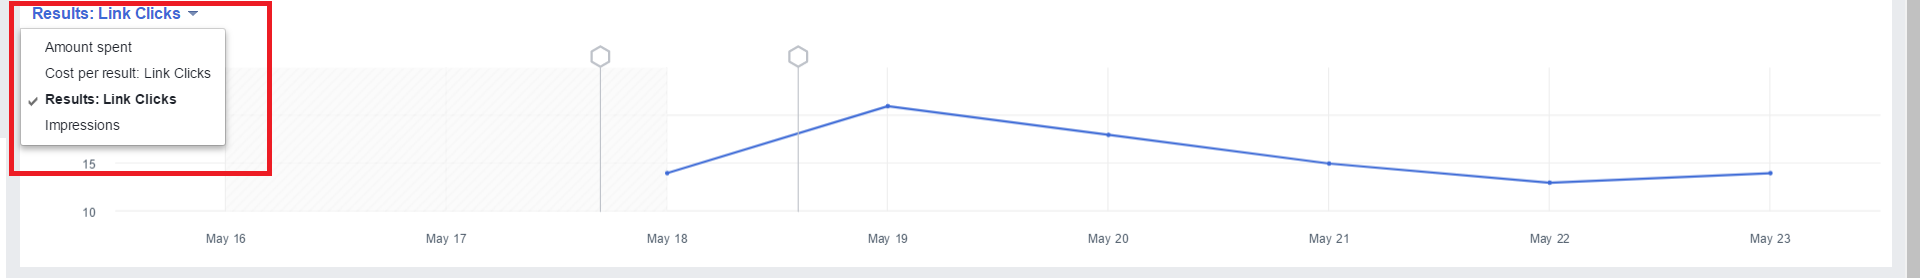
You can view the total amount spent, cost per result, link clicks (or whatever you optimized for), and impressions for a seven-day period.
If any of these metrics show a steady decline (i.e. your cost per click is rising per day or your impressions are falling each new day), then it is a warning sign that your ad set is no longer performing optimally.
Activity history, auction overlap, and audience saturation
To find out where your ads are going wrong you can look into its activity history, auction overlap, and audience saturation.
Activity history shows all the changes you made to your ad set, the time it was changed, what items you changed, and who changed it.
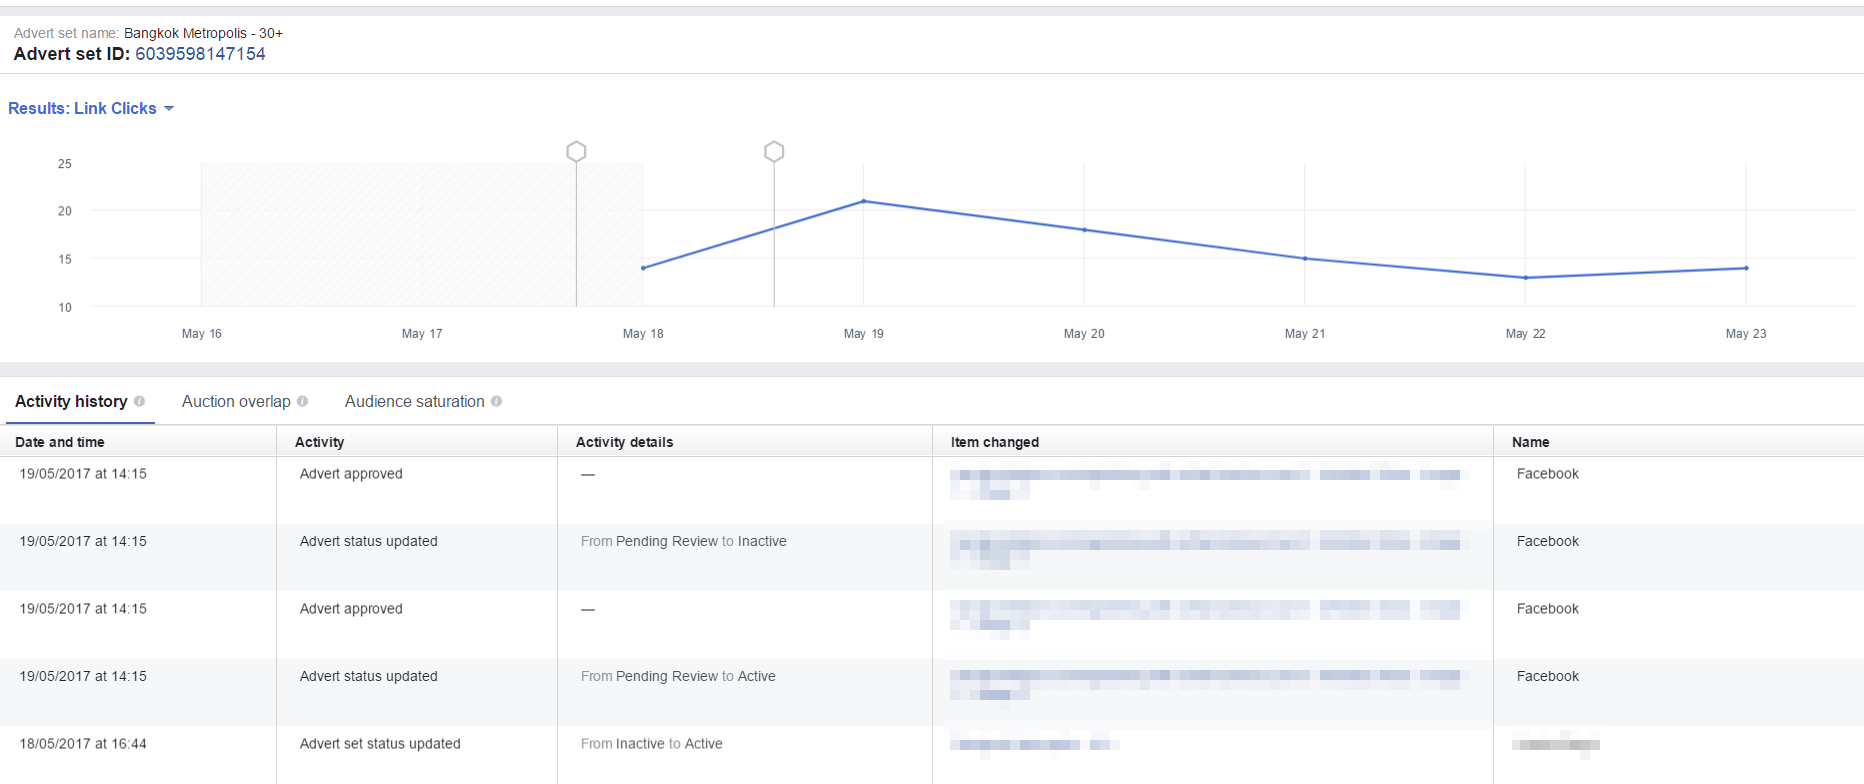
This is useful to follow if after making a change to your ad set, its performance drops. You can see exactly what changed, when it was changed, and who changed it. If your drop in results happened around the same time as a change, it becomes easier to troubleshoot the problem.
Auction overlap happens when audiences within your ad account (could be from other campaigns) are shown in the same bidding auction. For example, if you’re running Campaign A for lead generations and Campaign B for clicks, then if there is an audience overlap in both A and B, Facebook will automatically stop you from bidding against yourself and serves the highest performing ad set only.
This means that some of your ads may not get the distribution they need if your campaigns contain a lot of overlap.
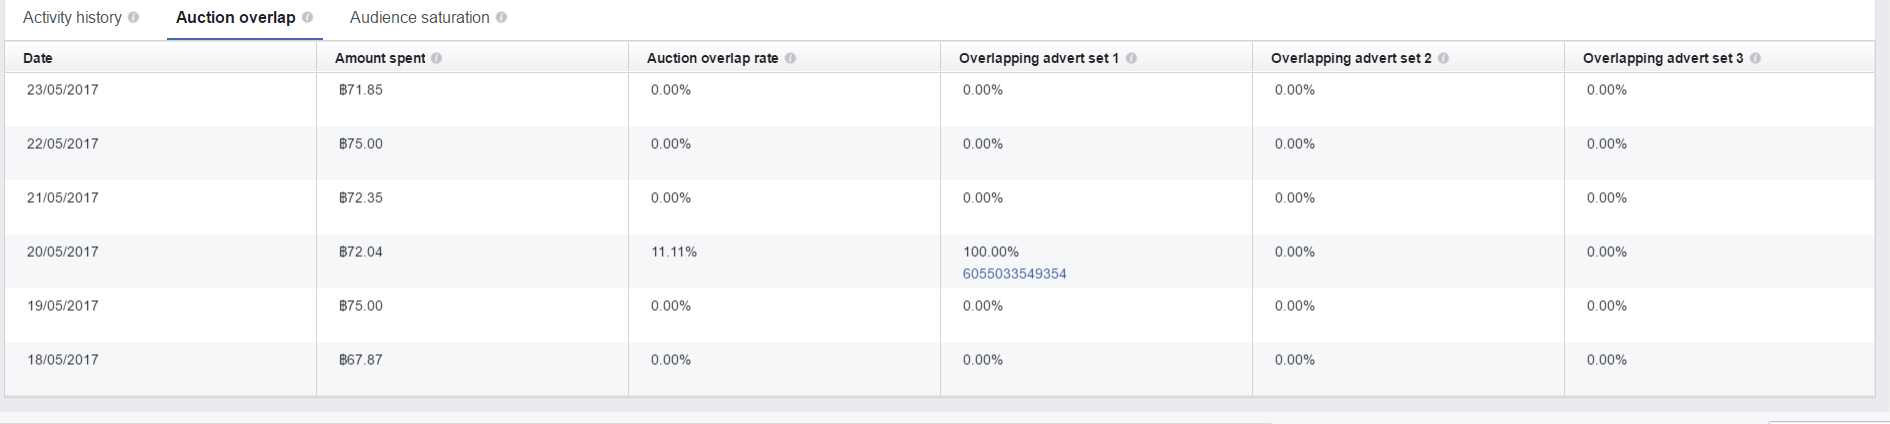
Facebook will show you the amount spent per ad and the total auction overlap rate for each ad set running. If a particular ad is receiving few impressions and has a high overlap, it’s most likely not being served as Facebook has prioritized another one of your ad sets over it in the auction.
However, high audience overlap isn’t necessarily a bad thing if your ad set is performing well. It only becomes an issue when it’s no longer reaching its desired goal.
One way to solve audience overlap is to merge both audiences together. For example, if your website visitors and Facebook fans had an overlap of 70%, you could place them in a single ad set. Another way would be to create more defined custom audiences and exclude certain audiences from ad sets.
The final nugget of information from Delivery Insights is audience saturation.
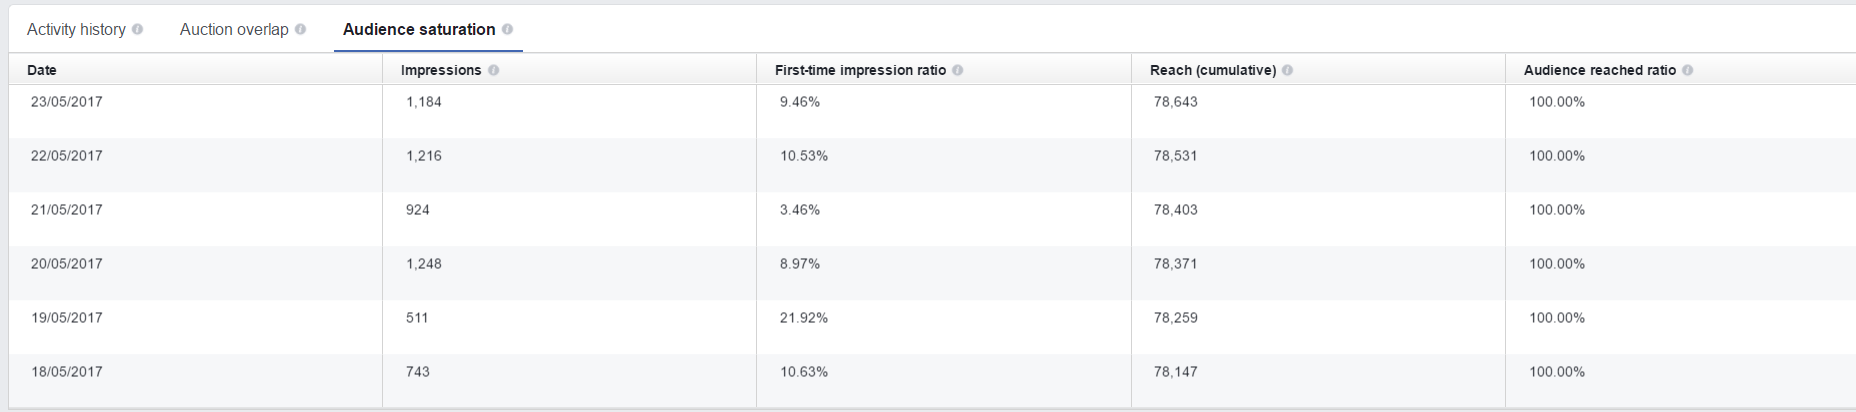
It is broken down into three parts:
Impressions – This is how many times your ad was served in a single day. If one user saw the ad twice, it is counted as two impressions.
First-time impression ratio – This is the total impressions for the day and how many saw your ad for the first time. In the example above, for the last running day only 9.46% viewed the ad for the first time.
Reach – This is the total reach of your ad during its lifetime.
Audience reached ratio – This is how much of your targeted audience has been reached.
In the screenshot above, there are two clear problems: the first-time impression rate is too low (one of the days received a total of only 3.46% of first-time impressions), and the audience reached ratio is 100%, meaning everyone who could have seen the ad has seen the ad.
To scale this ad or to drive more conversions, the audience must be expanded. Otherwise, the ad will end up fatiguing the audience.
Delivery Insights helps troubleshoot campaigns
If one of your most profitable campaigns suddenly takes a tumble, Delivery Insights is a useful place to start troubleshooting.
If your business targets a really niche audience (for example, website visitors and customers lists only), expect to have a much higher audience overlap than if you were using dozens of lookalike audiences or cold targeting.
A high auction overlap doesn’t mean your ad is under performing – ultimately your conversion numbers will tell you that. If sales drop or opt-ins are crippled, that is when you should start looking in to Delivery Insights to see if you can find out the issue.
Don’t be alarmed by the numbers or make rash changes if your campaigns are crushing it on Facebook; you might make an unnecessary adjustment that could turn a winning ad into a losing one.