If you use the performance and clicks column at the ad level, you have probably noticed the following new metrics appear:
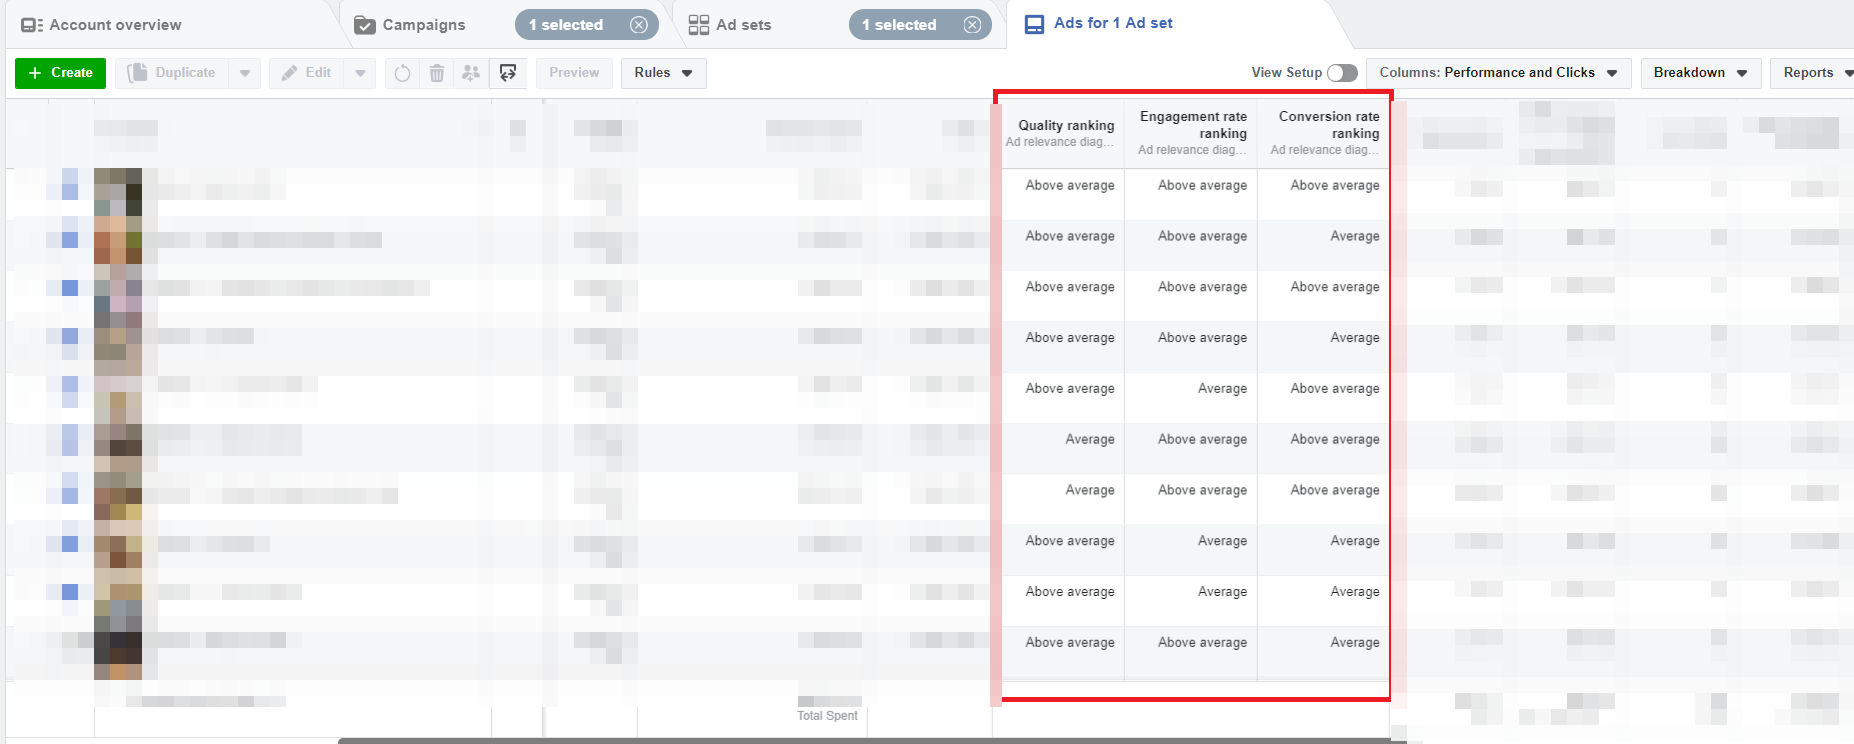
They are quality ranking, engagement rate ranking, and conversion rate ranking.
In this article I am going to discuss what they mean and how you can use them to get a better understanding of how your ads are performing at auction.
New quality scoring metrics
Before these new metrics were introduced to the Ads Manager, the only metric you could use to see how your ads were performing was the Relevance Score, which utilized a 1-10 scale.
One of the biggest issues with the Relevance Score was that you could have a score of 3-4 and still have a winning campaign well below your targeted CPA, which made it hard to know what to optimize for going forward.
To answer some of these issues, Facebook has launched three new metrics that provide you with a more detailed overview of how each ad is performing at auction.
Quality ranking – This aims to measure your ad’s perceived quality by using data from a user’s post-click experience, such as time spent on your site after clicking, and whether the user triggered any actions from your pixel.
Facebook includes how often users hide your ads and whether your content is classed as click bait or engagement bait.
Engagement rate ranking – This aims to compare the probability of engagement of your ads while on a user’s news feed to other ads that you’re competing against in the auction. To measure this, Facebook takes into account post reactions, shares, clicks, page likes, and other interactions.
Conversion rate ranking – This aims to measure your ad’s conversion rate. Once a user clicks on your ad, Facebook estimates how likely it will be that the user then completes your optimization goal as compared to the optimization goals of other businesses that are competing for the same audience in their auction.
Your ads will be given one of the following quality ratings:
- Above average
- Average
- Below average (bottom 35% of ads)
- Below average (bottom 20% of ads)
- Below average (bottom 10% of ads)
To see these metrics on your Ads Manager, your ad will need to have at least 500 or more impressions before Facebook shows you these results.
Improve your ad’s performance
These metrics are necessary to diagnose creative issues and discover where the problem lies.
For example, if you receive above-average ratings for the quality ranking and engagement rate ranking but a below-average rating (below 10%) for the conversion rate ranking, it’s a sign that the action you’re trying to optimize for is too difficult once users visit your site, but your creatives are doing very well at auction.
If you receive a below-average rating (below 10%) for your quality ranking, it means that your post-ad experience isn’t strong enough and users are leaving too quickly, which also means the message on your ad doesn’t flow over the page they are visiting (common with click-bait posts).
These metrics will provide more insights than just a Relevance Score on a scale of 1-10 and gives you more signposts on how to improve your ad.